As a group that heavily dogfoods our own products, the MyCloud team are regular users of the APIs fronted by the Rackspace Cloud Control Panel. Of these technologies, the Cloud Control Panel itself is run on top of a series of Cloud Servers that are watched by Cloud Monitoring. We tie these alarms into a variety of services to notify our DevOps team, from IRC bots to PagerDuty alerts.
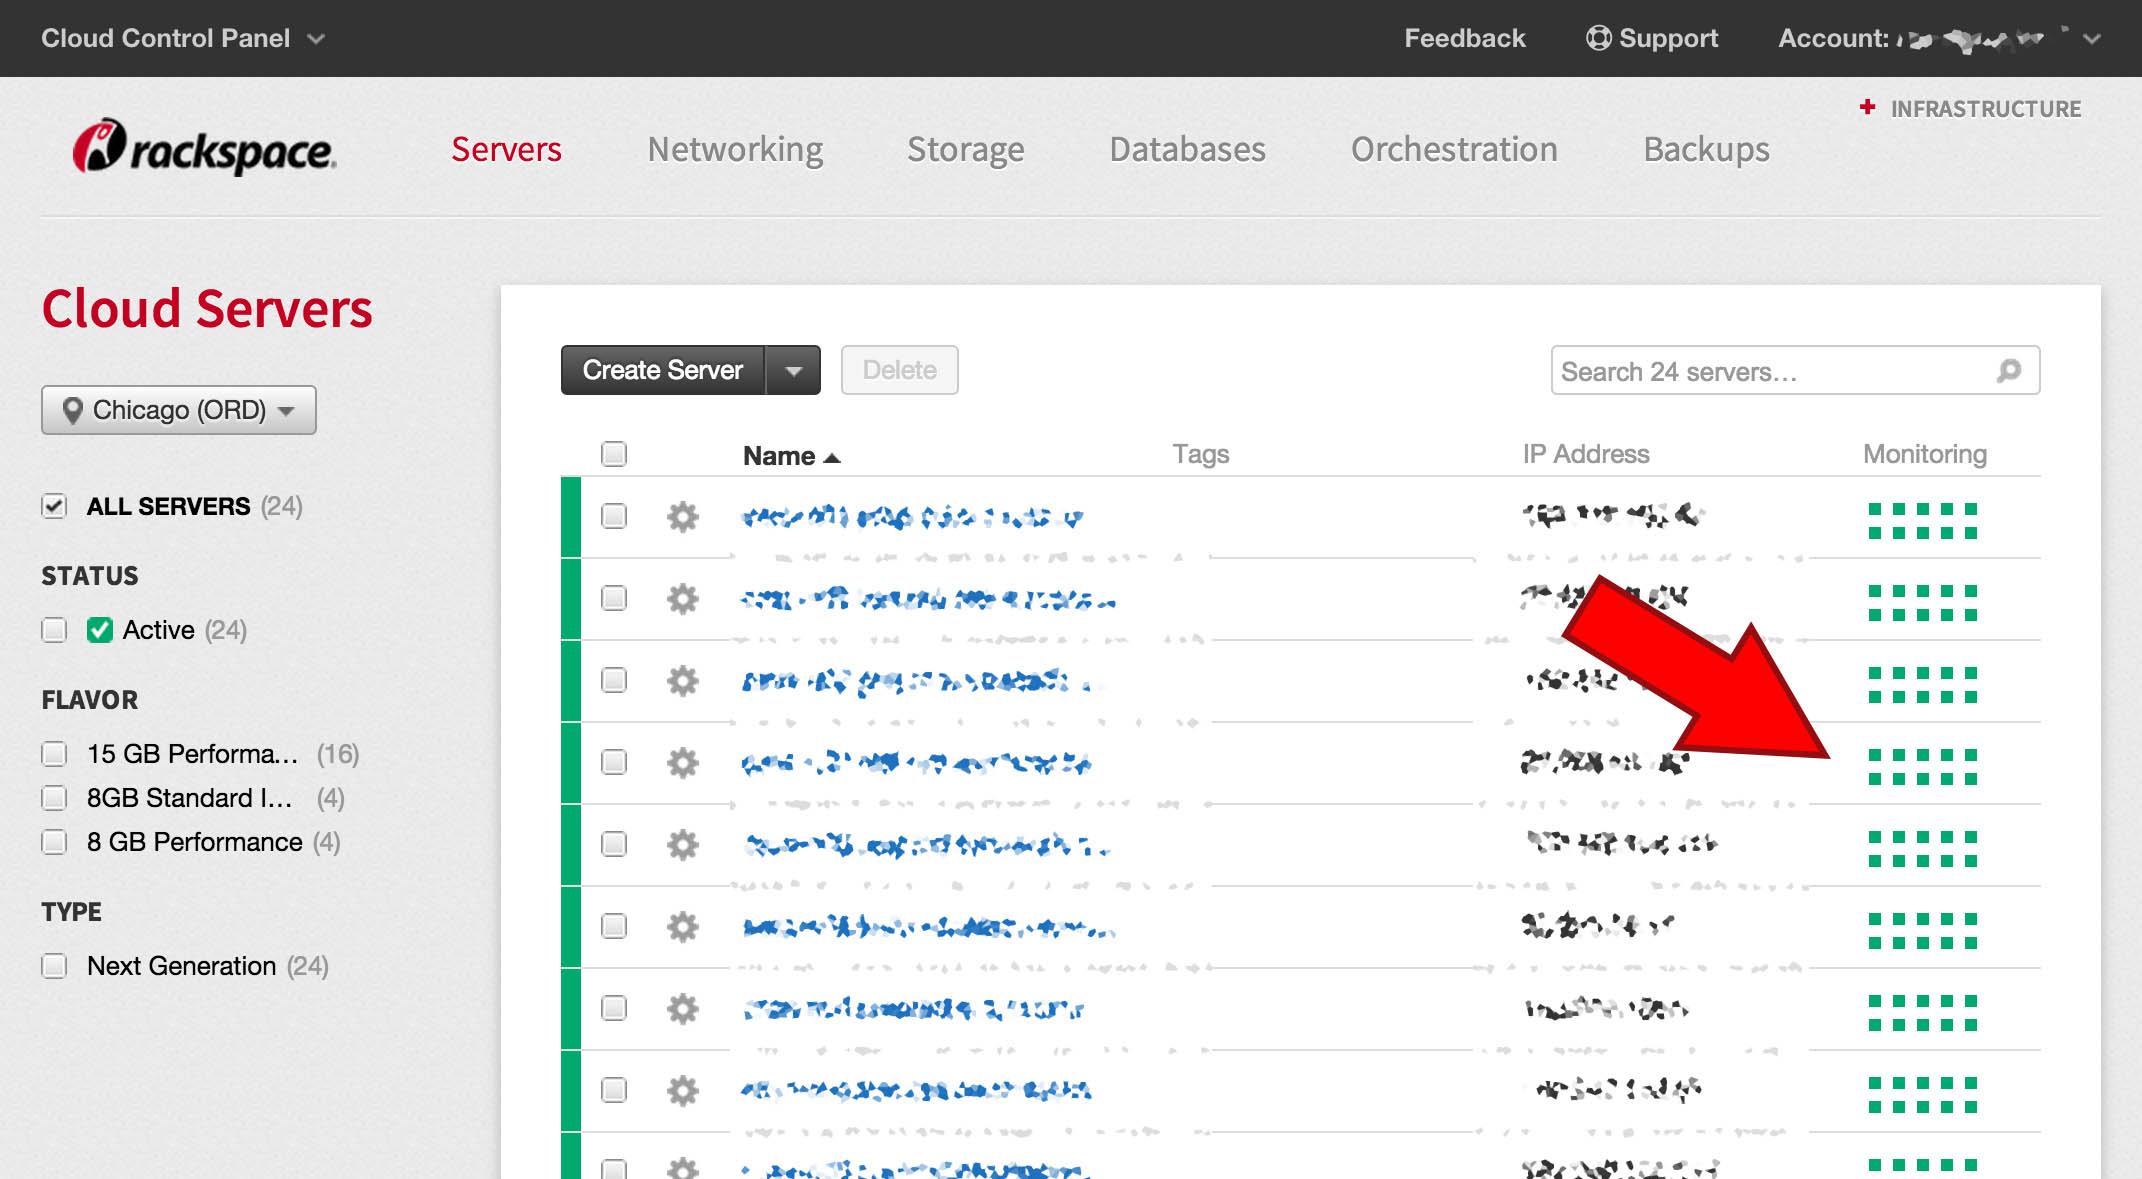
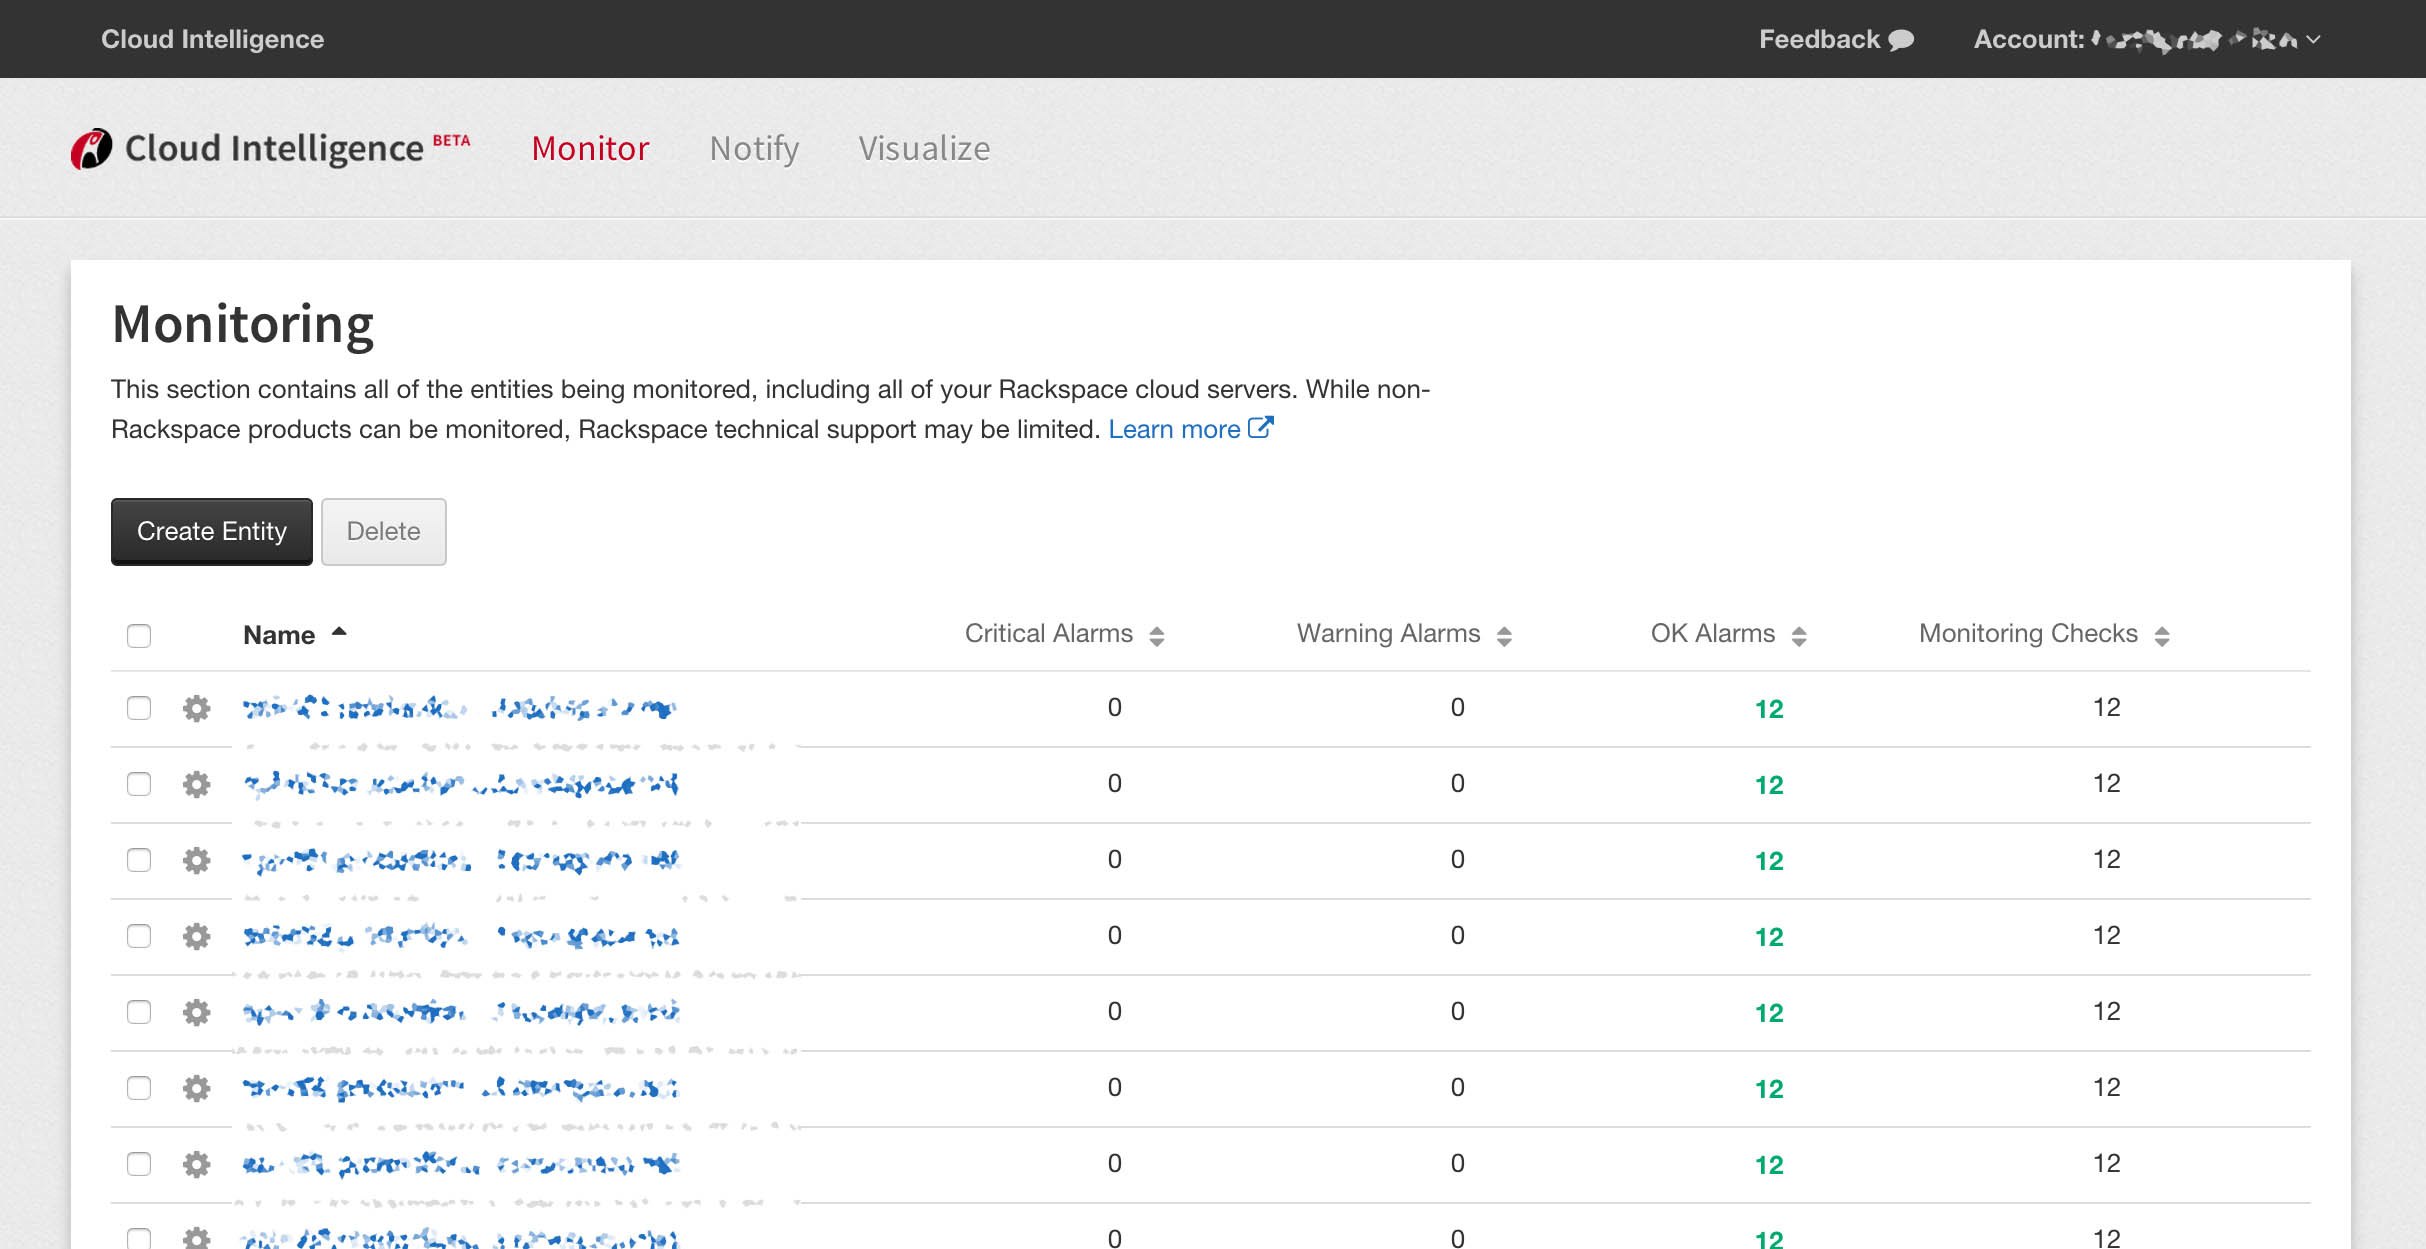
While both the Cloud Control Panel and Cloud Intelligence offer good overviews of the servers and monitors, our team was in need of a system that could achieve the following:
- Provide a quick overview of the status of all of the alerts.
- Span multiple accounts.
- Serve as a dashboard.
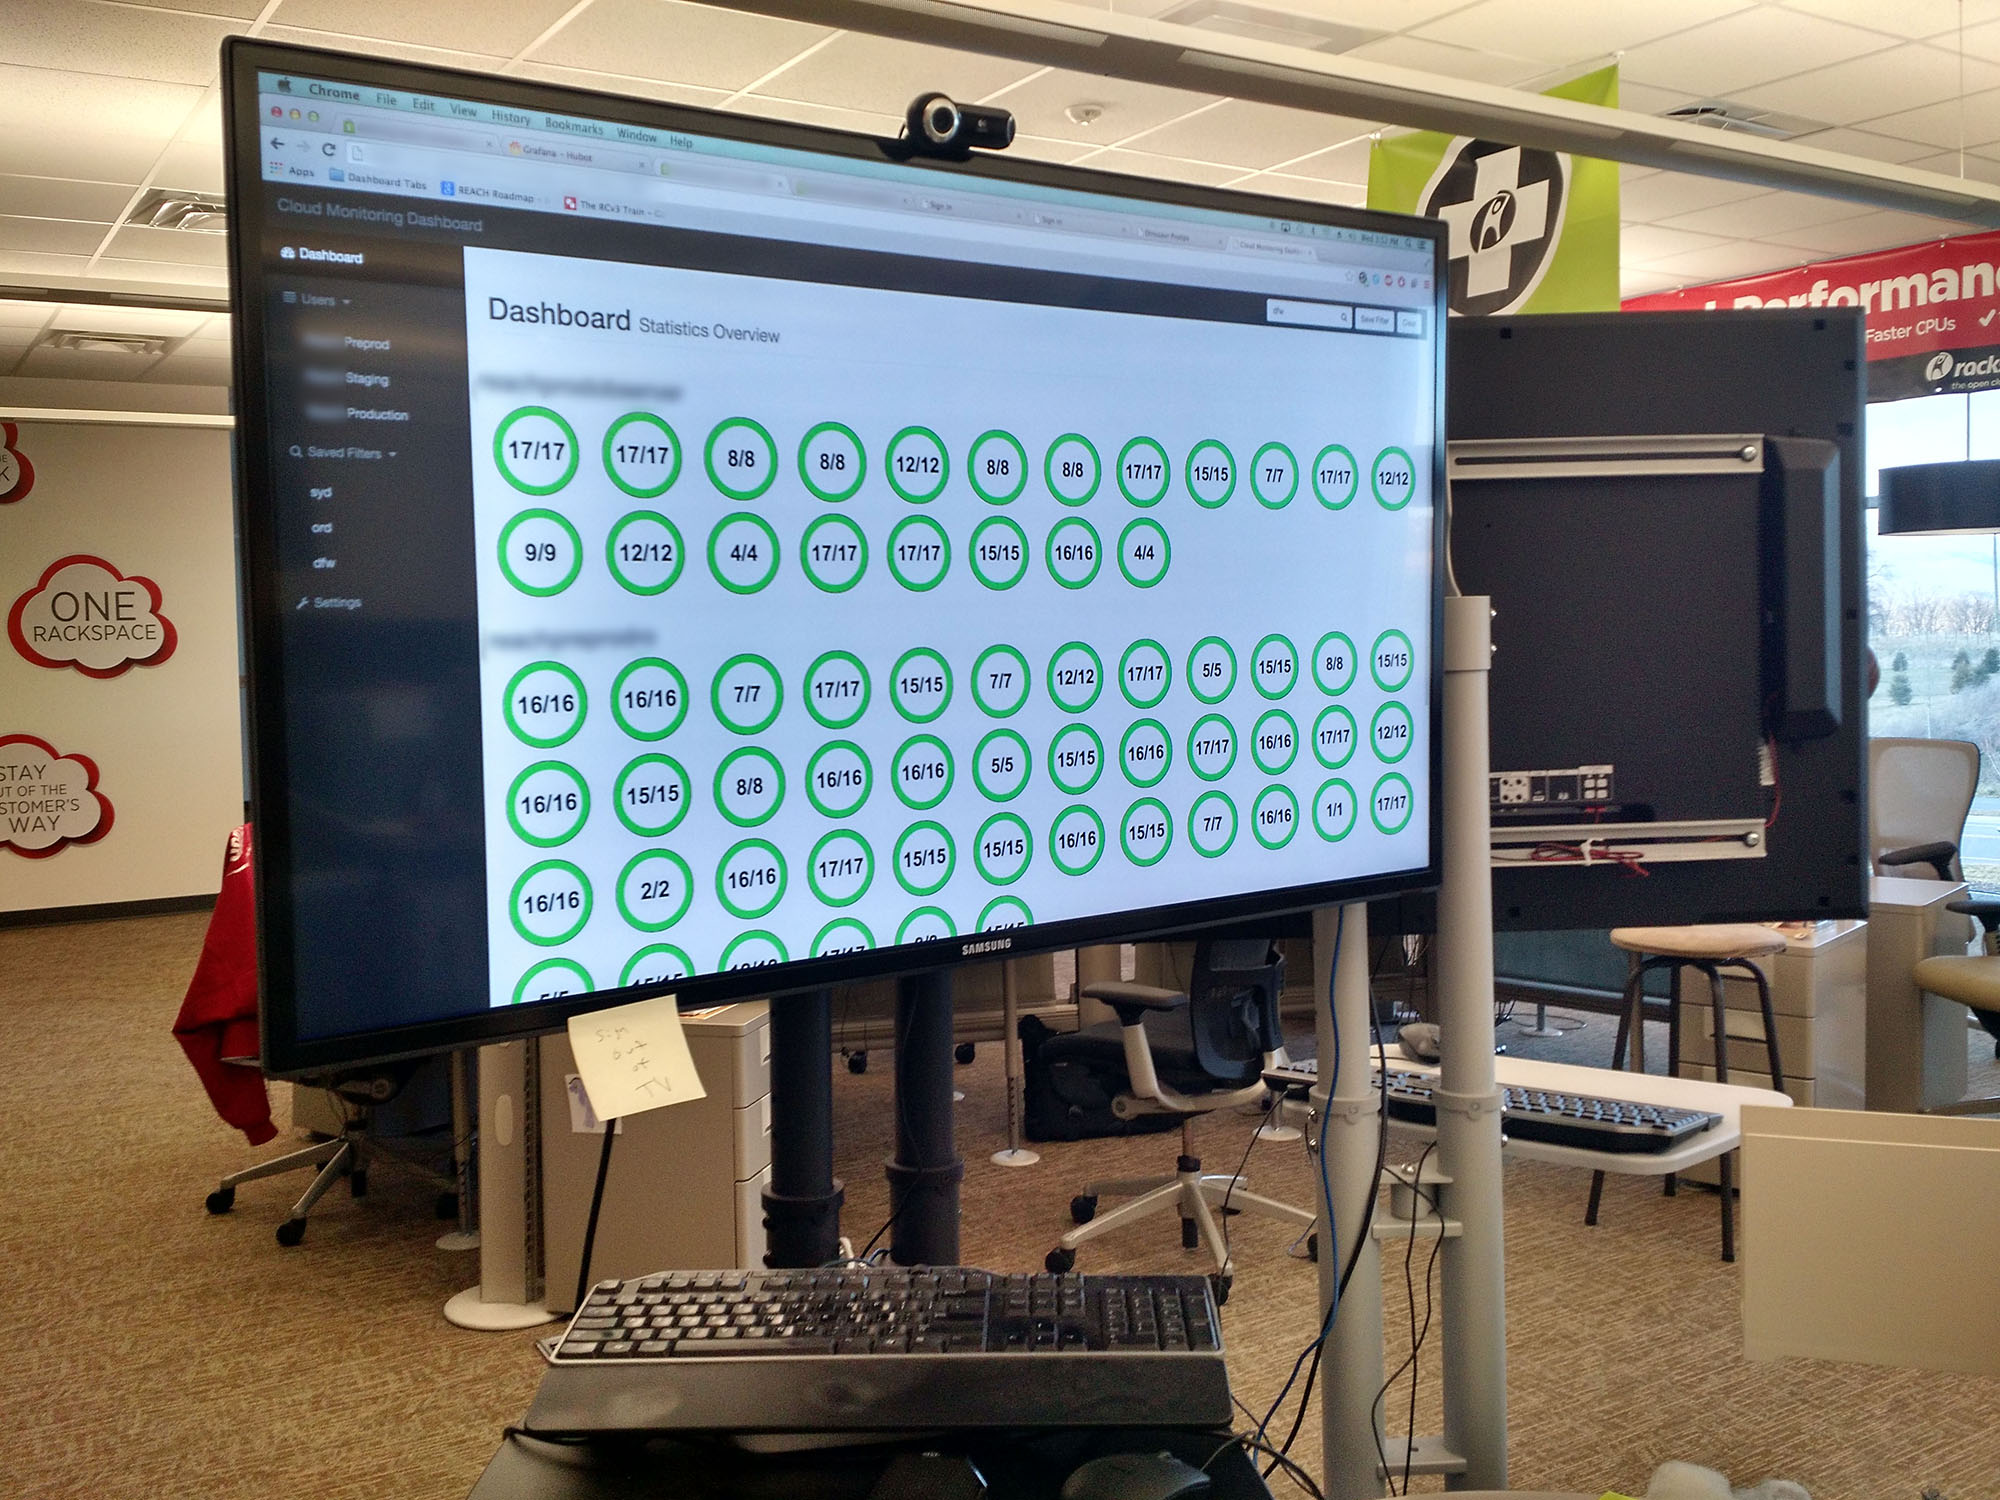
To fulfill these needs, we spent a portion of a team hackweek in early November designing a Cloud Monitoring dashboard. This dashboard, pictured below, provides an at-a-glance system status for all of our servers.
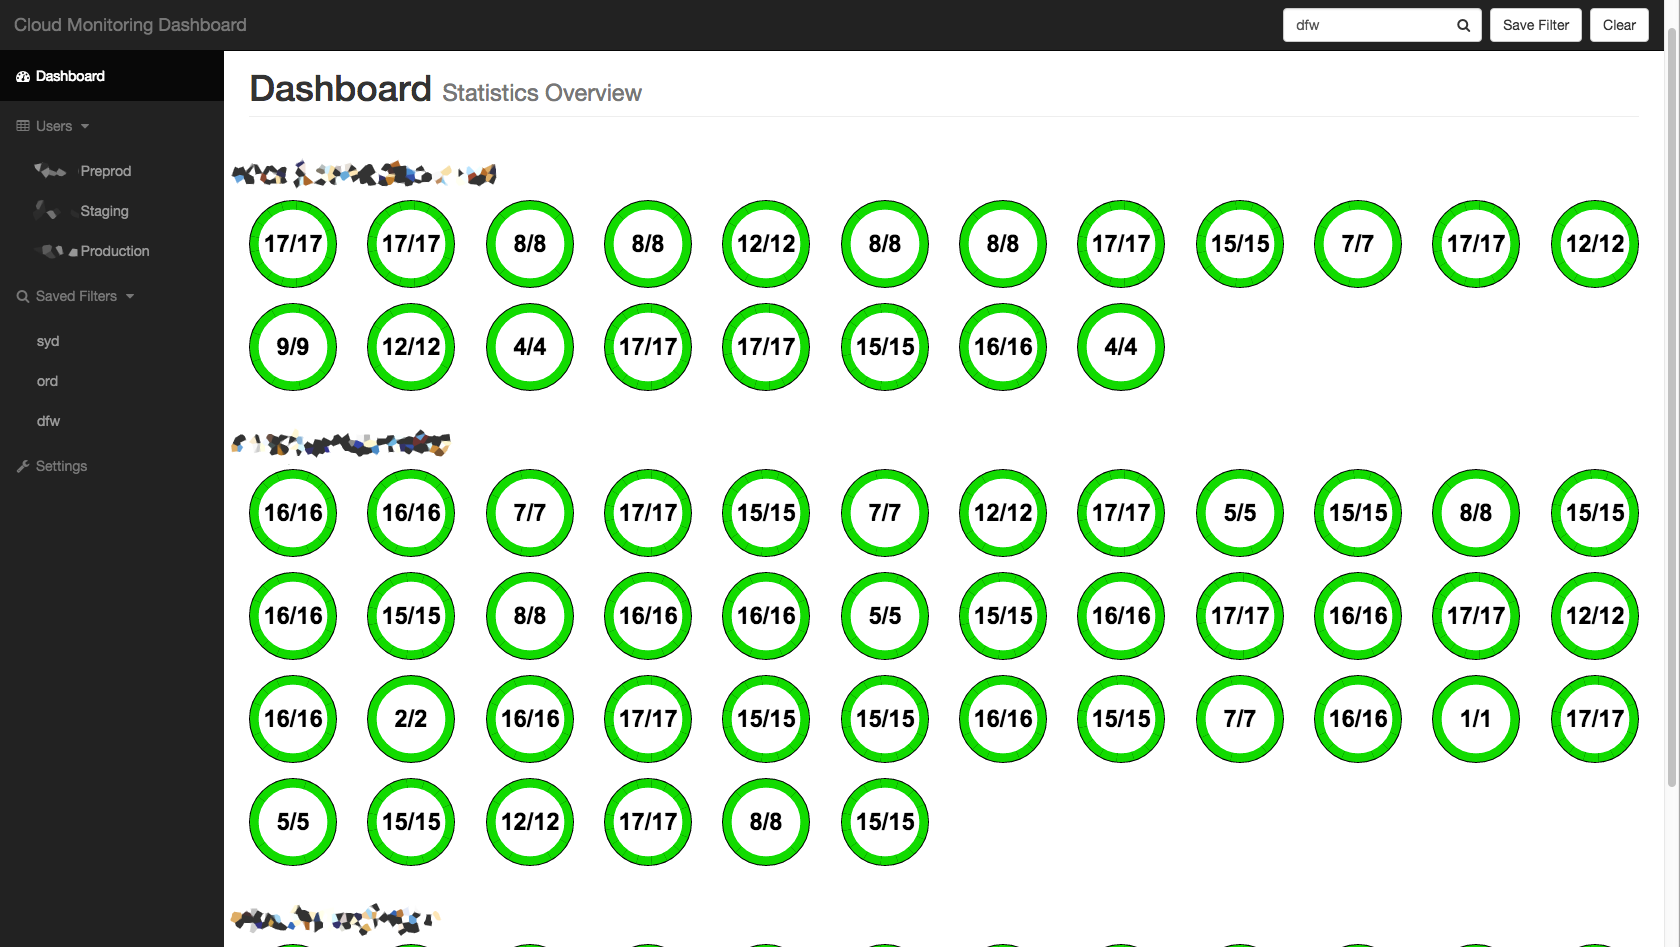
![]() Each circle represents a different server on the account. The numbers in the center represent the number of OK alarms and the total number of alarms on the server, respectively. The segmented green ring provides a visual representation of the number of alarms in a WARNING or a CRITICAL state.
Each circle represents a different server on the account. The numbers in the center represent the number of OK alarms and the total number of alarms on the server, respectively. The segmented green ring provides a visual representation of the number of alarms in a WARNING or a CRITICAL state.
On the backend, the dashboard is a Python Flask app with a dependency of Redis for caching and some basic persistent storage. The Flask app serves both the frontend HTML application and a JSON API (API details can be found on the project’s GitHub page). Once a user has been added to the dashboard through the settings page, the API authenticates with the user’s token and performs an Overview call to the Cloud Monitoring API. The results of this call are stripped down to the required components and stored in Redis.
On the front end, the dashboard uses Jinja2 for templating, Twitter Bootstrap for layout, and jQuery for dynamic content. The dashboard will refresh its contents from the API every 20 seconds.
The dashboard was specifically designed to run on Heroku’s free tier with Redis Cloud as the database provider. To try out the Cloud Monitoring dashboard with your own servers, click here:

To view the source, visit the project’s GitHub page: https://github.com/amussey/cloud-monitoring-dashboard